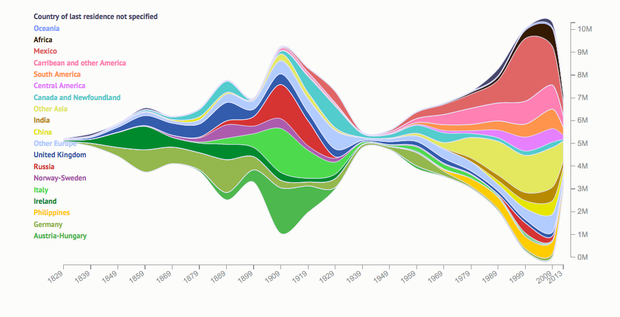
A new data visualisation captures the waves of arrival.
In 1819, Congress passed a law requiring that the arrival of all immigrants be recorded. Immigrant workers were needed, and the rest of the 19th century saw their numbers grow. From that period through today, America has seen waves of immigration, which Natalia Bronshtein has captured in a colourful interactive graphic.
“The point of this visualisation … is to get the big picture while preserving the ability to drill down into the details,” Bronshtein tells CityLab via email. “Much has been said and written about immigration to the U.S., but I wanted to get a birds-eye view, a reification of the issue, that would help me as I explored the topic further.”
When Bronshtein crunched the data from the yearbook of immigration statistics, she hadn’t expected such visually dramatic results. She says two things immediately jumped out at her.
From our partners:
First, that immigration didn’t just keep inching up once the flood gates had opened—there were significant bottlenecks caused by restrictive immigration laws. The biggest can be seen right after the Immigration Act of 1924 was passed. This law restricted people from Eastern and Southern Europe, Africa, the Middle East, and Asia from coming to America.
Second, after World War II, the diversity of immigrants increased, again because of a law. The Immigration and Nationality Act of 1965 removed the nationality-based constraints put in place by previous legislation. That law has contributed to the America becoming the melting pot it is today, saysBronshtein, and all the new bands of colors in the visualization in this time period testify to that.
In the last decade or so, the biggest waves in the immigrant tide come from Mexico (below, top) and East Asian countries other than India and China (below, bottom):
Check out the colourful interactive here.
This feature originally appeared in CityLab.


