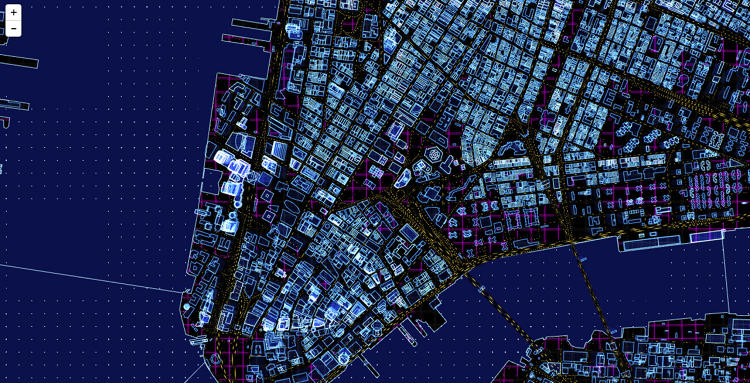
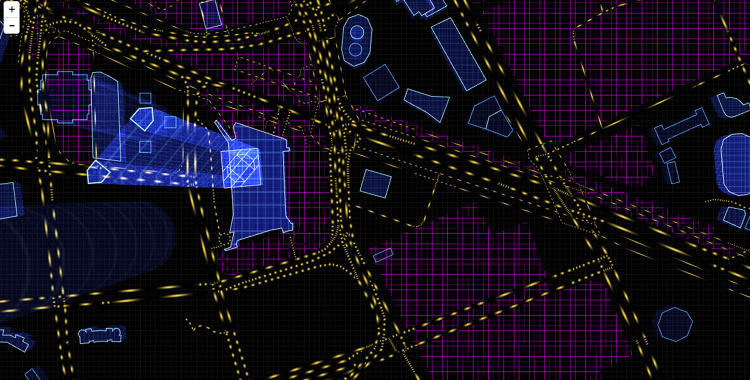
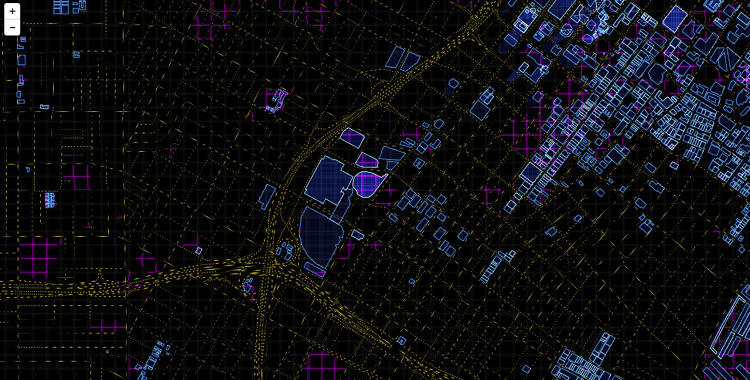
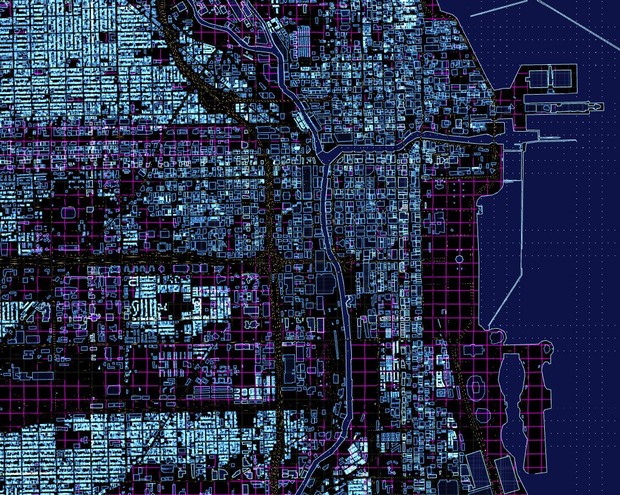
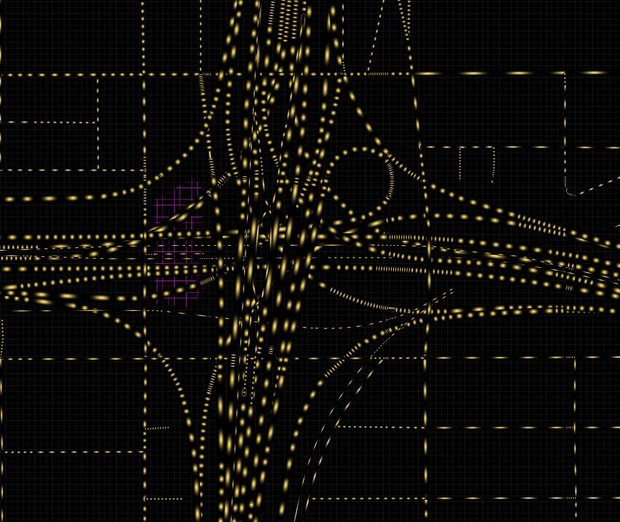
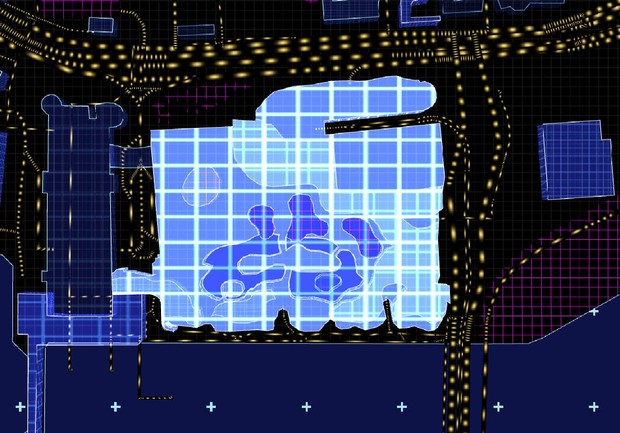
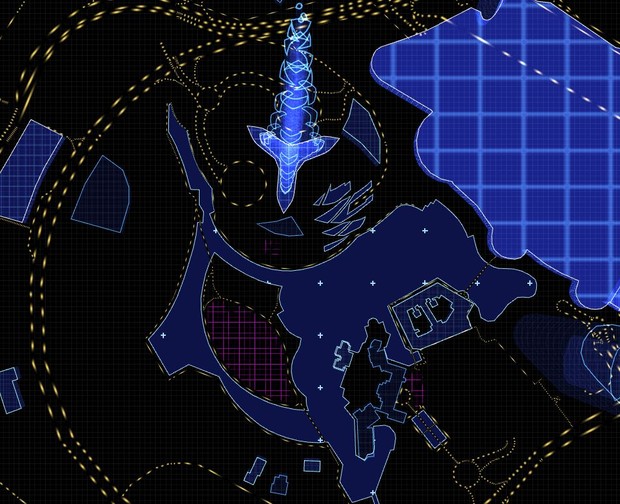
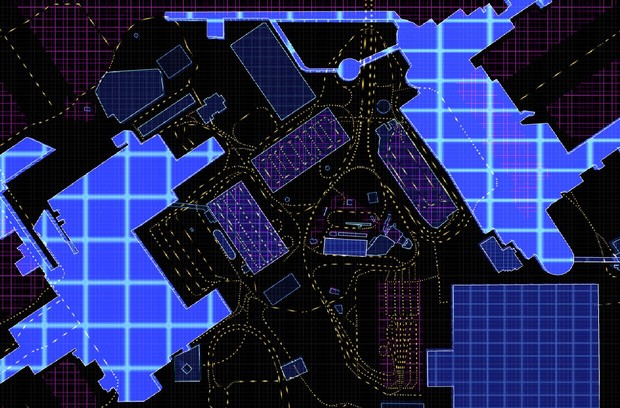
Stacks of geometric blue shapes represent skyscrapers. Cars become shooting yellow dashes moving across the landscape. Undeveloped land shows up as a neat purple grid, the greenery turned plaid. The map is most salient in the densest cities: Boston, L.A., and New York become pulsing, vibrant stacks of bright blue skyscrapers with cars zooming around like shooting stars, while in low-lying residential areas, development shows up as merely a black background criss-crossed by blocks of traffic.
The animated maps were made using Mapzen, an open-source 3-D mapping system. It defaults to a view of lower Manhattan, but you can zoom out to check out urban grids around the world, or just substitute your city’s coordinates for the default coordinates at the of the URL. Check it out here.

This article appeared in Fast Company and CityLab.


