What drives the economic momentum of the most dynamic metros in the United States? Each year, the Milken Institute’s Best-Performing Cities report identifies the latest trends and most relevant factors powering regional growth. Our index uses a comprehensive, fact-based set of criteria to rank the nation’s metropolitan areas. Among them are job creation, wage gains, and technology trends that shape current and potential patterns of growth. For metros looking to craft cohesive economic strategies, the report provides valuable data and insight.
Here are the first 10 highlights of the 2015 rankings:
San Jose-Sunnyvale-Santa Clara, CA
Overall Rank: 1 Population: 1,952,872
San Jose-Sunnyvale-Santa Clara, California, returns to No. 1 among large metros, a position it last held in the 2012 index. This past year, the San Jose metro division’s economy has been red-hot, demonstrating how an innovation-fueled ecosystem can overcome high costs of doing business and restrictive state regulations. San Jose had the highest job growth rate in the nation in 2014 (4.6 percent) among metro areas with a population exceeding 1 million.
From our partners:
San Francisco-Redwood City-South San Francisco, CA
Overall Rank: 2 Population: 1,611,050
San Francisco-Redwood City-South San Francisco, California, slipped to second place this year, barely eclipsed by its neighbor on the peninsula, San Jose. It is the closest second-place finish in the 16-year history of the Best-Performing Cities index. The San Francisco metro division’s economy remains one of the most vibrant in the nation. Its tech-fueled growth is attracting young knowledge workers from around the country and the world.
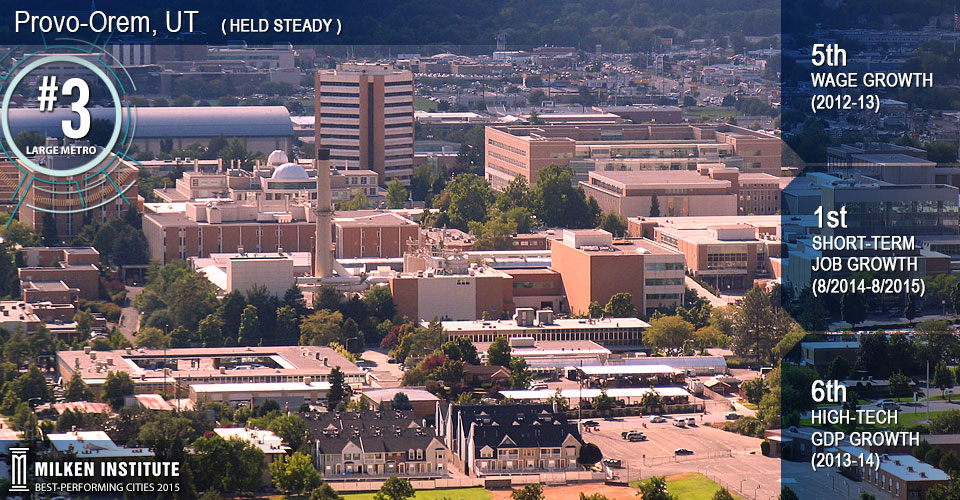
Provo-Orem, UT
Overall Rank: 3 Population: 571,460
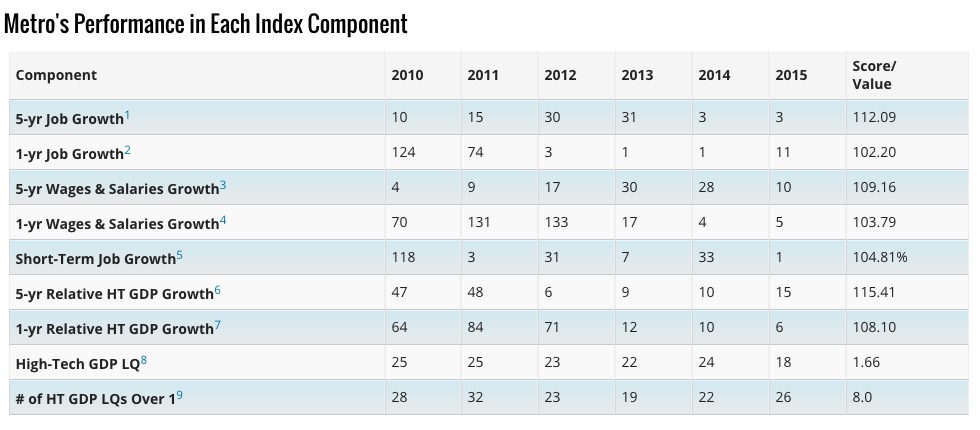
Provo-Orem, Utah, remains in third place this year, matching its 2014 performance. During the 12 months through August, job growth was 6.6 percent, the highest of any large metro area in the nation. Greater Provo provides a friendly business climate with low taxes and costs, creating fertile ground for indigenous startups and expansions by large tech firms headquartered elsewhere.
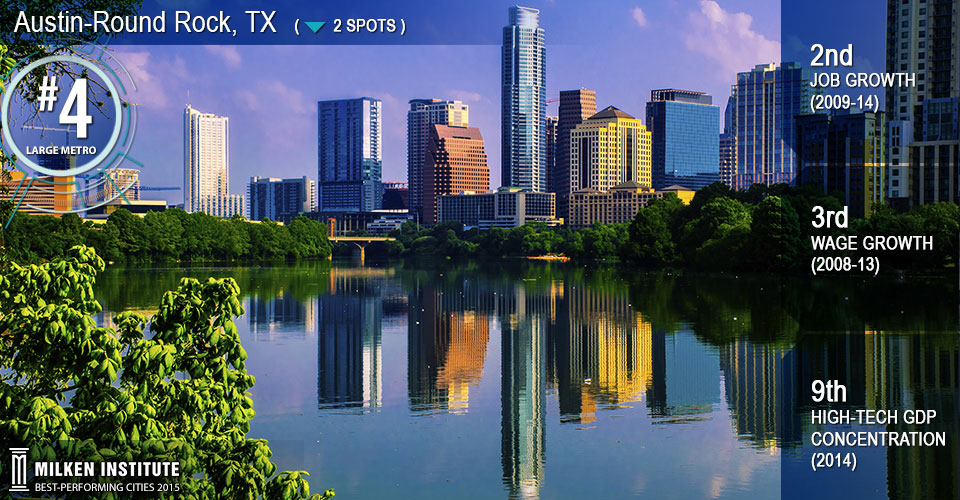
Austin-Round Rock, TX
Overall Rank: 4 Population: 1,943,299
Austin-Round Rock, Texas, remains among the Top 5 best-performing large metros at fourth place, slipping from second last year. It accomplished this feat despite a couple of shocks to its economy—the plunge in oil prices that reduced exploration activity and the high value of the dollar constraining exports of electronic components and computers. Nevertheless, the metro’s job growth ranked at a respectable 27th place in the nation, reflecting how much Austin has diversified its economy in recent decades.
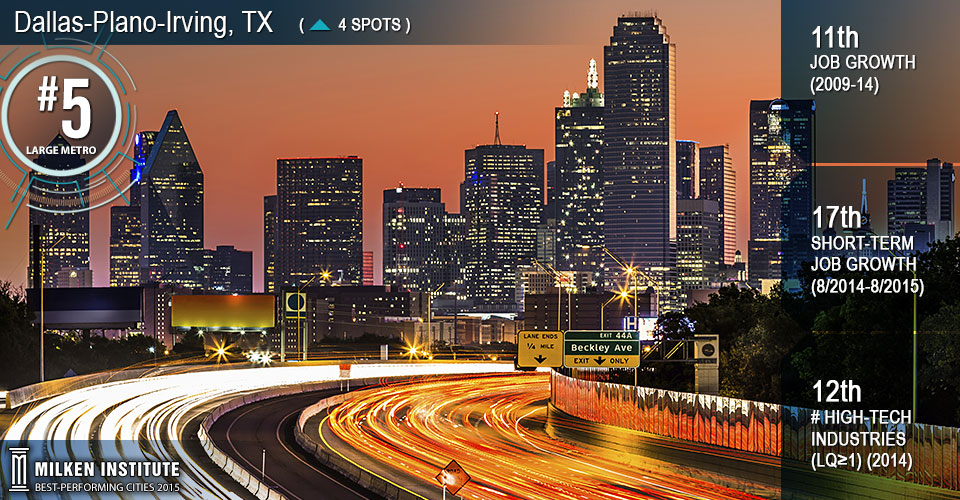
Dallas-Plano-Irving, TX
Overall Rank: 5 Population: 4,604,097
Dallas-Plano-Irving, Texas, would have been devastated by the magnitude of the recent oil price decline had it been three decades ago, but instead the metro finished fifth overall in 2015—a marked improvement from last year and a testament to its resiliency. The Dallas metro division has diversified its economy in part by becoming a regional financial services hub, as well as a key logistics and distribution center.
Raleigh, NC
Overall Rank: 6 Population: 1,242,974
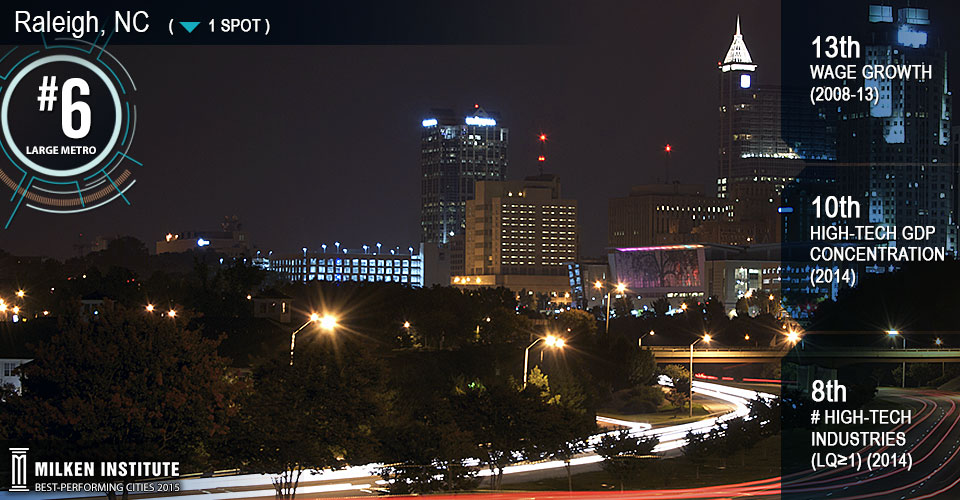
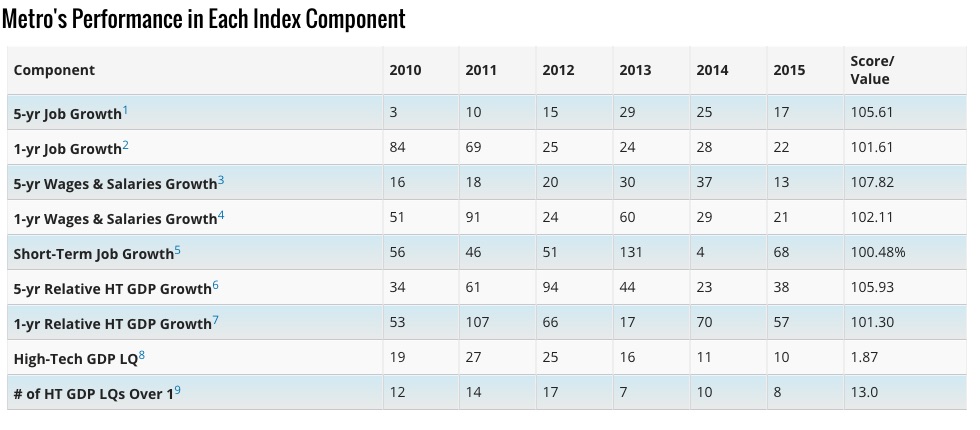
Raleigh, North Carolina, slipped one spot this year to sixth place. The region has consistently ranked among the top performers and this year it improved in one- and five-year job and wage growth. Innovation is a key driver of Raleigh’s success. The region ranks 10th in the importance of high-tech industries to its economy and eighth in the diversity of its high-tech industry base.
Seattle-Bellevue-Everett, WA
Overall Rank: 7 Population: 2,839,550
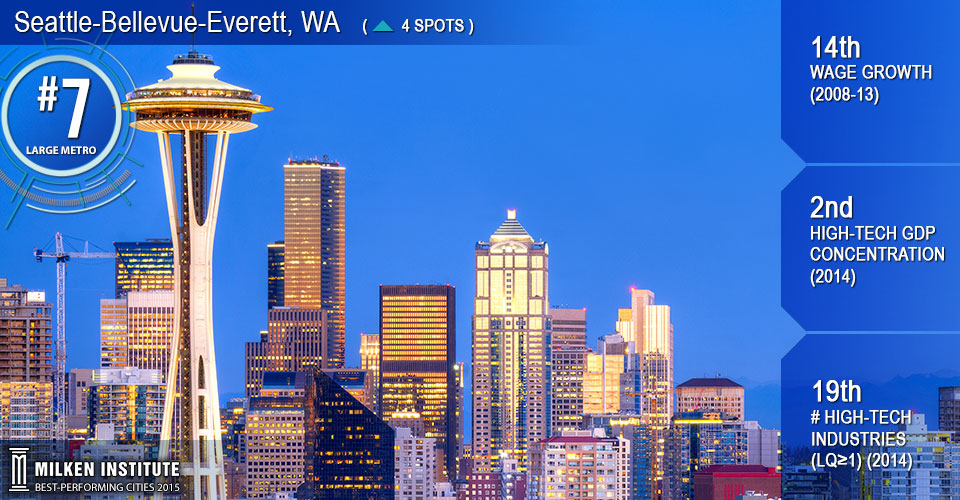
Seattle-Bellevue-Everett, Washington, is back in the Top 10, climbing four spots to seventh place. Much of its success can be traced to the technology sector. The region ranks second in the nation for the importance of high-tech industries to the local economy, up from fourth in last year’s index. They are key contributors to the metro’s strong wage and job gains in recent years.
Portland-Vancouver-Hillsboro, OR-WA
Overall Rank: 8 Population: 2,348,247
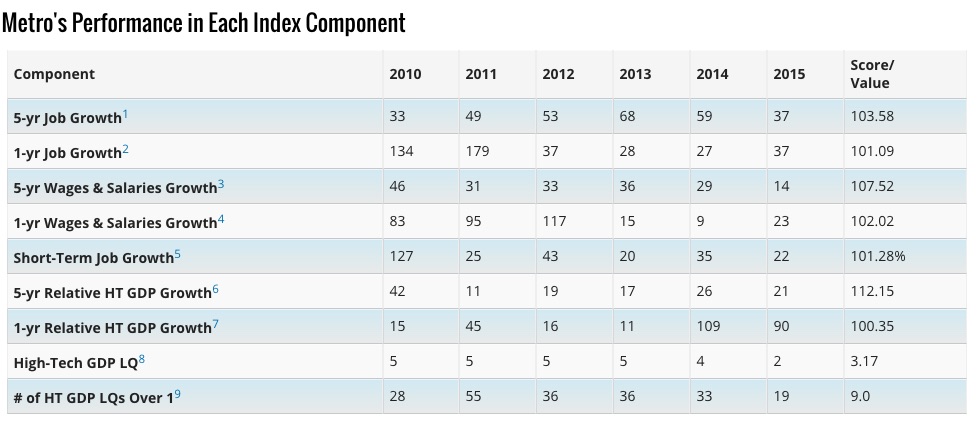
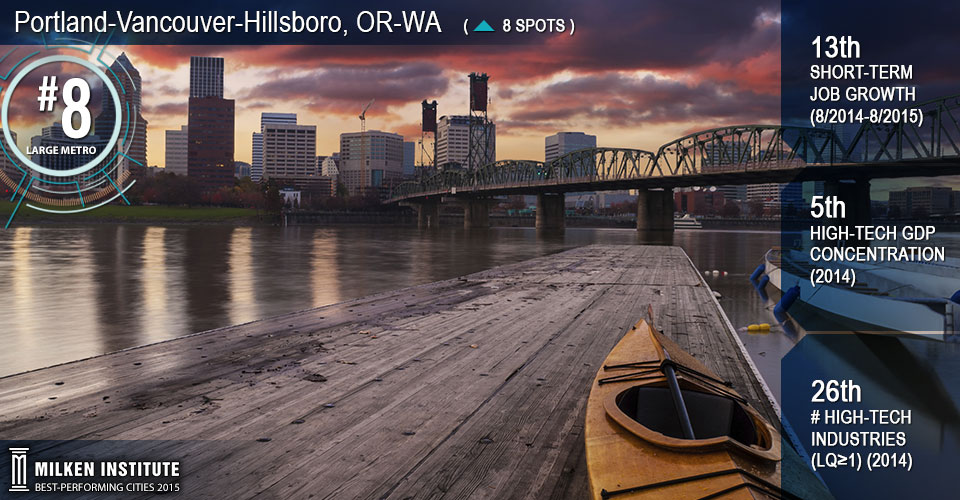
Portland-Vancouver-Hillsboro, Oregon-Washington, climbed eight spots to eighth place this year. Solid job and wage growth supported the metro’s exceptional performance in the index’s high-tech measures. It came in fifth for the concentration of its high-tech sectors, which continue to expand faster than the national average, though the gap has closed in recent years.
Greeley, CO
Overall Rank: 9 Population: 277,670
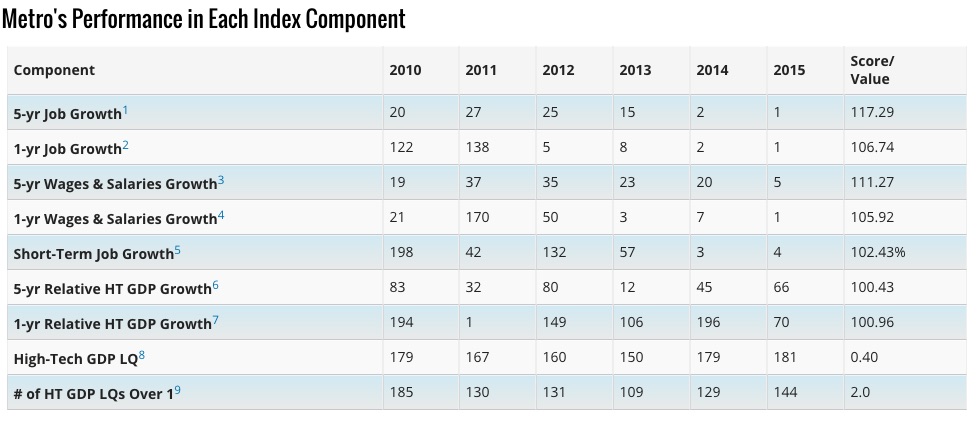
Greeley, Colorado, ranks ninth overall on the basis of unrivalled job growth. It took first place in both the one-year and five-year measures for employment gains, as well as the one-year measure for wage growth. The extraction of oil from the neighboring Niobrara shale has stimulated the metro’s wage increases, which were 11 percent higher than the national average in 2008 to 2013.
San Luis Obispo-Paso Robles-Arroyo Grande, CA
Overall Rank: 10 Population: 279,083
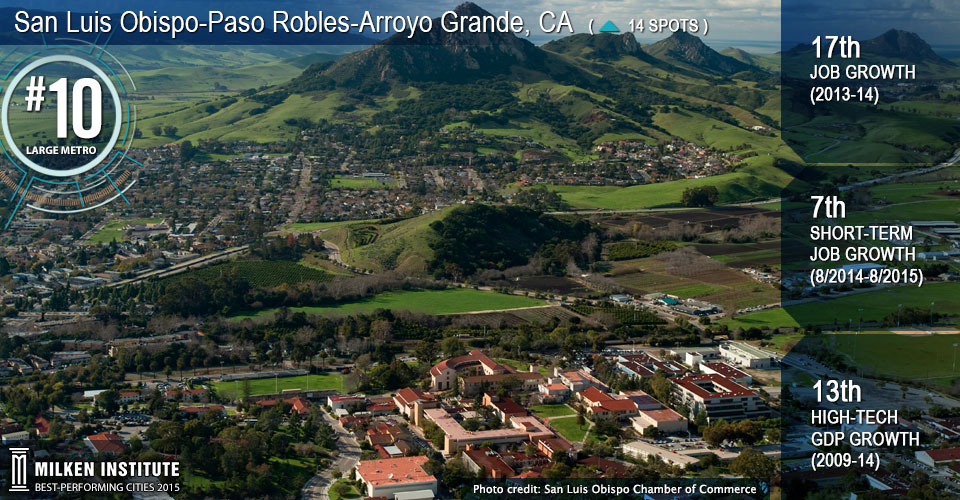
San Luis Obispo-Paso Robles-Arroyo Grande, California, rose 14 places to join the Top 10 this year, building on its impressive climb up the rankings last year. Experiencing strong job gains over all three periods evaluated, the region ranked seventh for employment growth over the most recent 12 months, placing 2 percent higher than the national average.
This year’s findings reveal how technology and oil again played significant roles in regional economies but in vastly different ways as those industries moved in opposite directions. The nation’s tech centers are prominent among the index’s top performers, as are cities that have experienced high technology growth rates. Conversely, the slashing of oil prices has undercut the economic performance of several metros whose fortunes are tied to shale-oil extraction.
In the United States overall, business and consumer spending on technology products and services is a powerful force in economic growth. Metros involved in designing and creating these products and services are growing most rapidly. Specifically, the composition of growth has shifted toward software and social media, and away from information and communication technology (ICT) equipment. In fact, businesses now spend more on software than on ICT equipment. This softer, creative side of high tech is spurring a renewal of many urban cores. Look to San Francisco, Seattle, Denver, and even New York City to see the extent of this phenomenon. Witness, too, the contributions of science-based industries such as biotechnology, medical devices, and diagnostic and semiconductor equipment manufacturing.
These thriving sectors are in contrast to the shale-oil exploration industry. The decline in oil prices from roughly $100 per barrel in September 2015 to around $45 currently has rubbed the economic sheen off communities that benefited from the surge in hydraulic fracturing-driven oil exploration. Oil production has remained at elevated levels, but new exploration has dropped by more than 50 percent. The economics of U.S. shale-oil exploration are such that, for most projects to cover capital costs, prices needed to be around $70 per barrel. Some oil deposits could be economically developed at oil prices substantially below $70 and remain active areas of exploration. On the other hand, the lower price regime reveals the value of diversification: Several metros that branched out to other industries even when their economies were formally dependent on oil now continue to thrive. Here, think of Dallas, Denver, and San Antonio, among others.
This feature originally appeared in Best Cities.


