The 2020 race to the White House has been the most divisive for a generation. The campaign has been derailed by the COVID-19 pandemic, which so far has taken the lives of nearly a quarter of a million Americans – more than any other country in the world.
But the fractures running through US society long predate the pandemic. Here are six charts that reveal America’s deep social and economic divides.
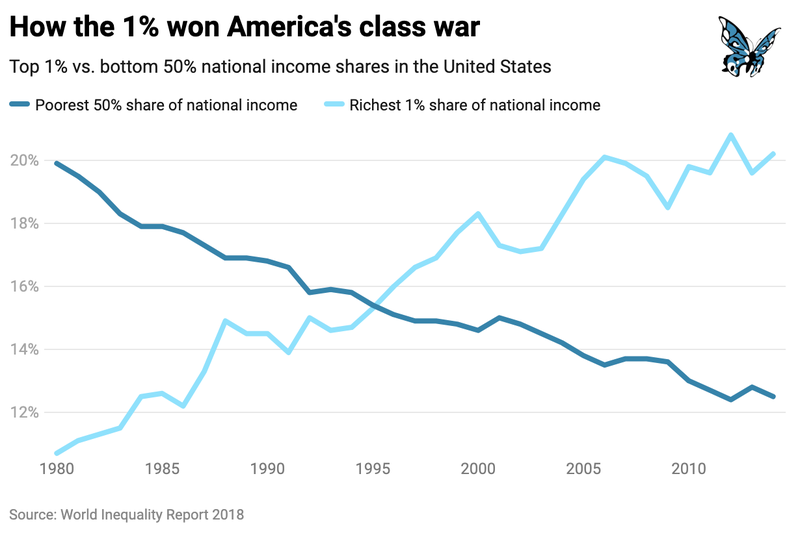
1. How the 1% won America’s class war
In 1980, the top 1% of earners took home 10% of US national income, and the bottom 50% of earners took home 20%. By 2016 however, these positions had reversed: the income share of the top 1% had increased to 20%, and the income share of the bottom 50% had decreased to 13%.
In other words: over the past four decades the top 1% have hoovered up an ever-growing share of national income at the expense of ordinary Americans. Although ‘class war’ rhetoric has never been popular in Washington, the reality is that lawmakers have been waging a class war for decades – on behalf of the rich against everyone else.
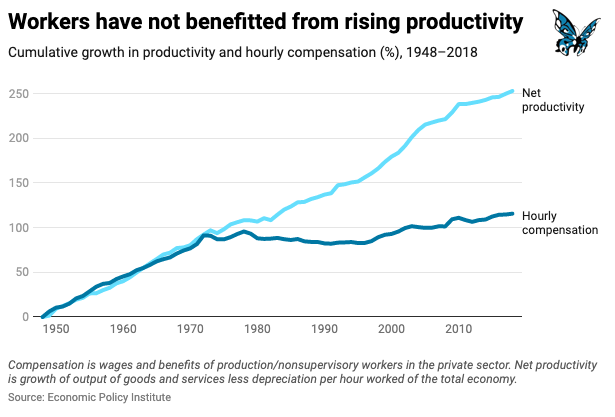
2. Workers have not benefited from rising productivity
Under capitalism, we are often told that ‘a rising tide lifts all boats’ – that as the economy grows, everybody should share in the rewards. And in the decades following the Second World War, this was broadly how the US economy worked.
From our partners:
Throughout the 1950s and 1960s, the hourly compensation of typical workers increased in line with productivity (how much workers produce per hour). In other words, as the economy became more productive and output expanded, American workers benefited through pay rises.
But in the 1970s, the link between productivity and pay began to break down. Between 1979 and 2018, productivity rose by 70%, while the hourly pay of typical workers essentially stagnated – increasing by only 12% after adjusting for inflation.
Although Americans are working more productively than ever, they are not reaping the equivalent financial rewards.
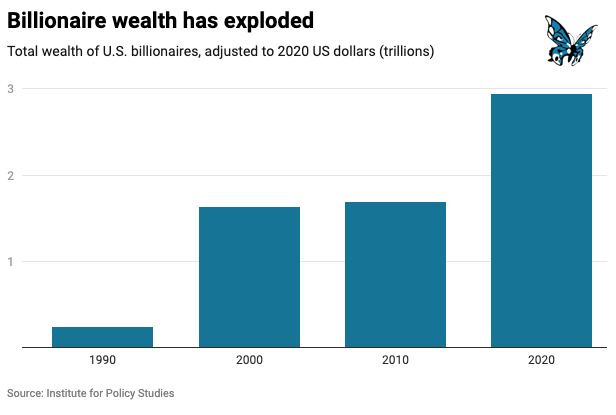
3. Billionaire wealth has exploded
If ordinary workers haven’t benefited from rising productivity, then who has? The answer can be found in soaring corporate profits, skyrocketing executive pay and the amassing of vast individual fortunes.
In 1990, there were 66 US billionaires who had a total wealth of $240 billion (in 2020 dollars). Today the US has 614 billionaires with a total wealth of nearly $3 trillion.
Between 1990 and 2020, American billionaires saw their net worth increase by over 1,130%, while median household net worth grew by only 5%.
Today three American billionaires – Jeff Bezos, Bill Gates, and Warren Buffett – own as much wealth as the bottom half of all US households combined.
4. Millions of Americans have zero or negative wealth
While the total amount of wealth in the US has grown enormously over the past 50 years, not all Americans have become wealthier. Between 1963 and 2016 families at the bottom of the wealth distribution (those at the 10th percentile) went from having no wealth on average to being around $1,000 in debt. Meanwhile, families in the middle more than doubled their wealth, and those near the top (at the 90th percentile) saw their wealth increase fivefold.
The wealth of those at the 99th percentile – those wealthier than 99% of all families – grew sevenfold. These changes have caused wealth inequality to skyrocket.

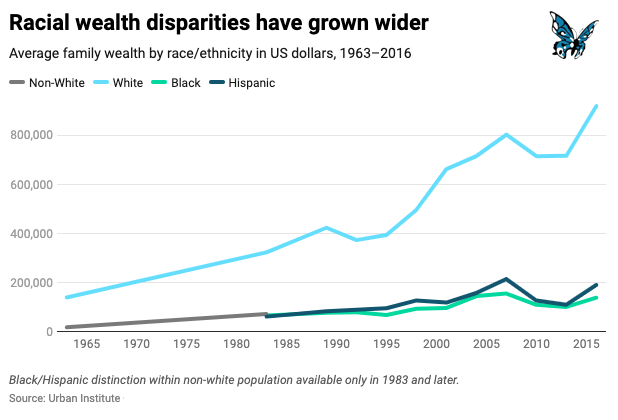
5. Racial wealth disparities have grown wider
The Black Lives Matter protests have shone a spotlight on the systemic racism that still plagues US society – from policing and criminal justice, to housing and healthcare.
But vast racial disparities also exist in the distribution of wealth. In 1963, the average wealth of White families was $121,000 higher than the average wealth of families of colour. By 2016, the average wealth of White families was over $700,000 higher than the average wealth of Black families and Hispanic families.
This means that in 2016 White family wealth was still seven times greater than Black family wealth and five times greater than Hispanic family wealth on average.
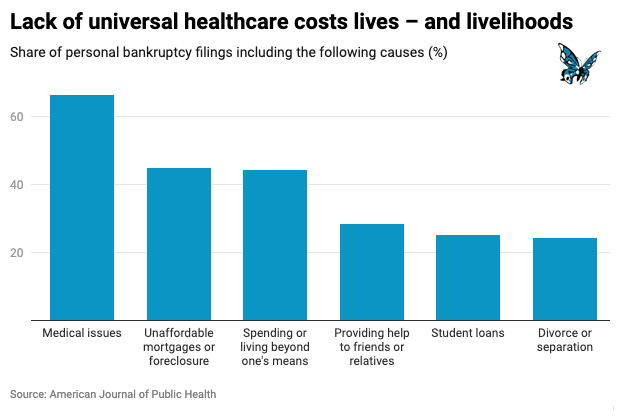
6. Lack of universal healthcare costs lives – and livelihoods
The US is unique among advanced economies in not providing universal healthcare coverage to its citizens. Despite spending more on healthcare than any other country in the world, one study found that 45,000 Americans die every year as a result of not having any health insurance coverage. Since the COVID-19 pandemic began in March, 12 million people have lost their employee tied health insurance.
But the lack of universal healthcare not only costs lives – it also costs livelihoods. A recent study in the American Journal of Public Health found that 66.5% of all bankruptcies were tied to medical issues — either because of high costs for medical care or because of time taken out of work. An estimated 530,000 families turn to bankruptcy each year because of medical issues and bills, the research found.
This is significantly more than other causes such as unaffordable mortgages , spending or living beyond one’s means, providing help to friends or relatives, student loans, or divorce.
