Advances in weaponry and cartography had deadly repercussions in World War I, which the United States entered 100 years ago today.

MAPS COURTESY LIBRARY OF CONGRESS

MAPS COURTESY LIBRARY OF CONGRES

MAPS COURTESY LIBRARY OF CONGRESS

MAP COURTESY LIBRARY OF CONGRESS

MAPS COURTESY LIBRARY OF CONGRESS

MAPS COURTESY LIBRARY OF CONGRESS

MAPS COURTESY LIBRARY OF CONGRESS
By the time the United States entered World War I, 100 years ago today, the conflict had been raging in Europe for nearly three years. It was to become one of the deadliest wars in human history, claiming more than 15 million lives.
Advances in military technology—including more lethal artillery and rapid-fire machine guns— contributed to the heavy toll. Maps, too, played a role. Recent cartographic innovations allowed artillery gunners to fire at targets they couldn’t directly see and aim their guns without first firing “ranging shots” that would ruin the element of surprise. Airplanes—another relatively recent invention—allowed both sides to update their maps daily with the positions of enemy troops.
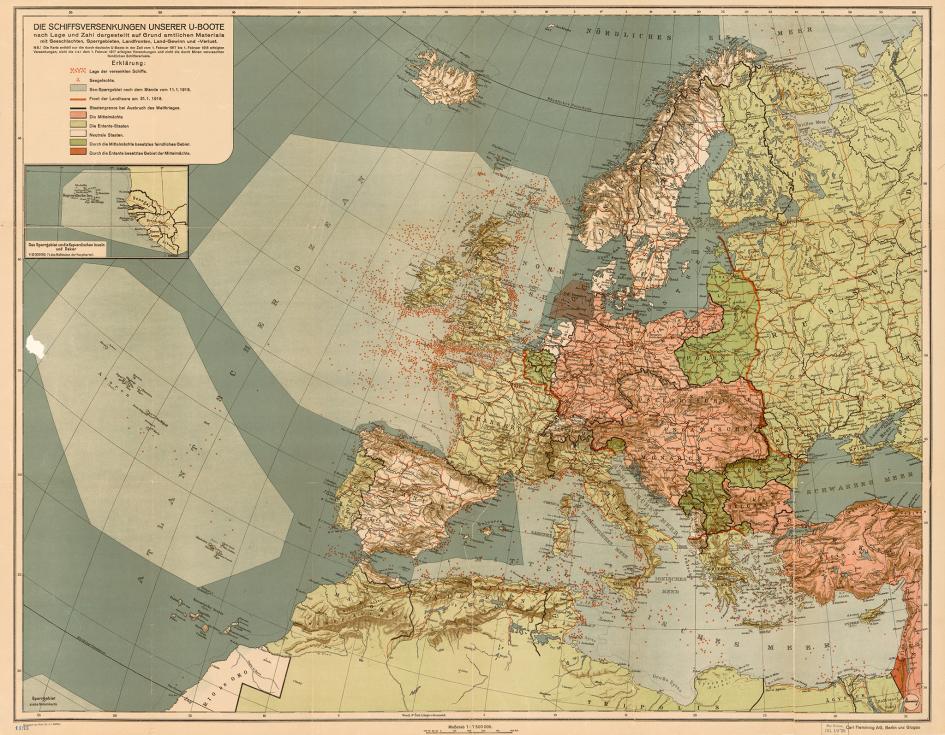
The maps in the gallery at the top of this post illustrate these deadly innovations and other defining features of the war, including the complex networks of trenches dug by both sides and the devastating German U-boat attacks on Allied commercial ships—a major factor in drawing the U.S. into the conflict. Many of the maps, which come from the Library of Congress, were featured in a recent paper and two blogposts by Ryan Moore, a cartographic specialist at the library with an interest in military history.

MAP COURTESY LIBRARY OF CONGRESS
Throughout most of human history, people could only take aim at an enemy they could see. By WWI that had changed, thanks to powerful artillery that could fire well beyond the line of sight. But this created a new challenge: how to aim at a target that’s not directly visible.
From our partners:
One approach was to use spotters, who’d take up a vantage point on a hill or other elevated area and send messages back to the gunners about where their shots were landing. Radios had been invented by that point, but they were still too bulky to be widely used in the field. Instead, both sides used cable telephone lines—and human runners when the lines got cut by enemy fire.
“Someone would actually be running back and forth through the shell fire to communicate the messages,” Moore says. The gridded map below, which shows the effective range of different types of artillery pieces, is an example of the type used by spotters and gunners to coordinate artillery fire. It’s no work of art, but it represents a remarkable step in the evolution of warfare.

MAPS COURTESY LIBRARY OF CONGRESS
Aerial photography turned out to be another deadly innovation. Flying was still new and dangerous back then, but photos shot from above vastly improved tactical maps, Moore says. “These guys would risk their lives in these ‘flying coffins,’ as they were called, flying at 12,000 feet above the enemy with a guy leaning out the back with a camera.” That altitude was considered safe from anti-aircraft fire, but photographing crucial details sometimes required flying lower.
“They would be taking photos on a daily basis, and a whole crew of analysts would pore over the photos looking for the smallest changes in the landscape,” Moore says. To speed the process along, pilots would fly over the mapmakers’ position and drop the latest film from the plane in a cannister, along with notes on the crew’s observations. The mapmakers would develop the film in the field and update the maps with new targets.

MAPS COURTESY LIBRARY OF CONGRESS
In the meantime, of course, the enemy would be on the move again. Both sides dug elaborate networks of trenches to protect their men and enable them to hold a line. At the highest levels of command, the positions of friendly and enemy troops alike would be depicted (see above). But maps given to junior officers showed only enemy troop locations, Moore says. A junior officer would already know the position of his own troops, so there was no need to put that on a map that could be captured by the enemy.
Another new technology put to deadly use in WWI was the submarine. Although military subs date back to the American Revolutionary War, the Germans’ widespread use of U-boats to attack civilian and commercial vessels was unprecedented. Several maps in the gallery depict the war at sea, including British intelligence maps of efforts to track a notorious German raiding vessel and keep their own harbors free of German mines.
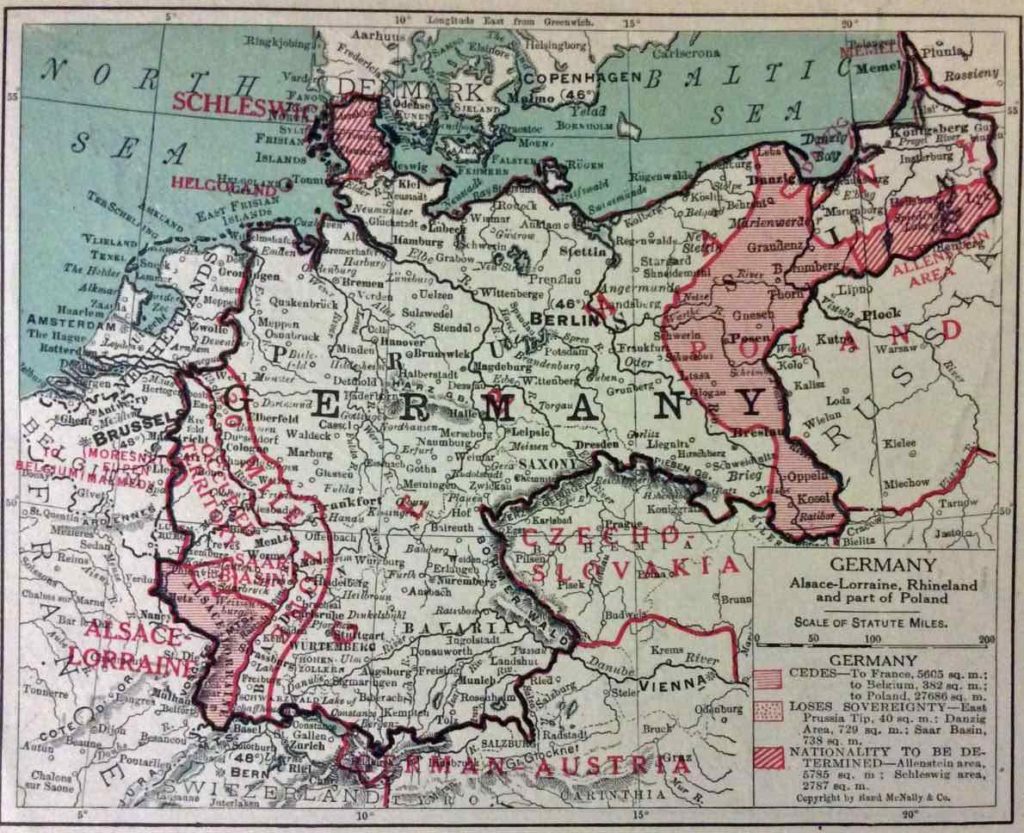
Most of these maps were never seen by civilians. But after the war ended, people around the world were fascinated by maps of the treaty negotiations. Redrawing the borders of Europe was a contentious and political process—and the end result helped set the stage for World War II—but maps published around this time (like the one below) were wildly popular, Moore says.
“All sections of society were interested in these changes,” he says. “What’s the world going to look like now?”

MAPS COURTESY LIBRARY OF CONGRESS
This feature originally appeared in National Geographic.


