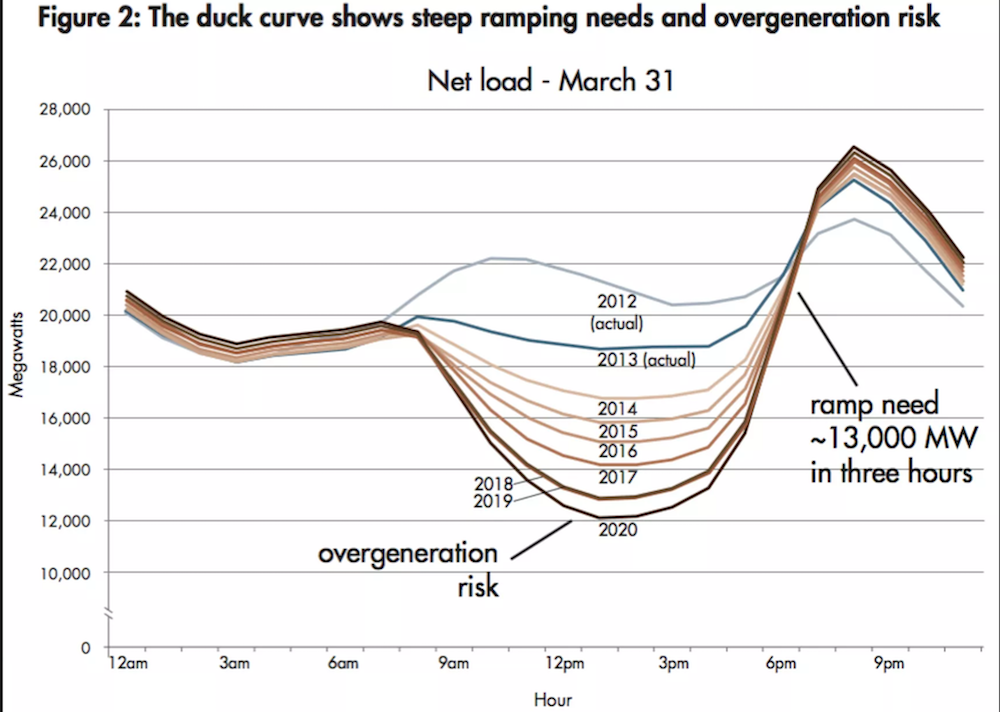
Electricity is very difficult to store. But most consumers use it in a very predictable pattern. So utility managers use demand curves to anticipate the electric needs of their customers. And as solar energy expands, their job is getting a bit more difficult.
Solar energy production peaks at mid-day, and this causes demand for other energy to drop off. Researchers in California call this seeming drop in demand the “duck curve.” The more solar energy capacity increases, the more the curve looks like the belly of a duck. Here is the chart that illustrates the issue:
That dip creates a few problems for management of the power grid. Watch the video to learn the basics about the duck curve. If you’re looking for further information on solar energy production and power grid management, I recommend reading more from Vox’s David Roberts.
This feature is written by Carlos Waters & originally appeared in Vox.


