Researchers hope mobility data gleaned from Twitter during Hurricane Sandy can eventually help boost New York City’s resilience.

When Hurricane Sandy‘s 14-foot storm surge slammed into New York City in 2012, more than 1.5 million households immediately lost power. Some nine out of the 14 subway tunnels under the city’s rivers flooded, and the subway remained closed for days. All told, 43 New Yorkers died, and tens of thousands were “injured, temporarily dislocated, or entirely displaced by the storm’s impact,” according to a city report.
In the two years since, the city has vowed to become a more “resilient” New York. How can the city improve infrastructure’s ability to recover and persist in the midst of disruption? How can local communities learn the particular strengths and weaknesses of their man-made structures and spaces?
And how can a better understanding of mobility patterns during a disaster—where and how far people go, and when—help cities better protect their residents?
[infobox]”This will become powerful when it becomes a form of intervention, a way to communicate with people who are in areas they shouldn’t be.”[/infobox]Two researchers in civil engineering are beginning to answer that last question. In a recent paper published in PLOS One, John E. Taylor, an associate professor and director of the Civil Engineering Network Dynamics Lab at Virginia Tech, and Ph.D. candidate Ryan Qi Wang examine a trove of Twitter data to quantify how human mobility patterns changed in the immediate wake of the storm.
From our partners:
Their findings, they hope, could eventually help predict movement patterns in a future disaster, and inform cities of where and when to bolster services.
Using 702,188 geo-tagged tweets from 53,934 distinct individuals, Taylor and Wang mapped the locations of each Twitter user during the first 24 hours of the storm, October 29 to October 30. In the image below, each black dot represents a location of a Twitter user. The areas in red denote official evacuation zones. The green points represent locations where fatalities occurred.
Using tweets from the same users but sent later on in that initial 24-hour period, they mapped each individual’s “unique mobility trajectory,” or the amount of distance crossed between one tweet to another. Below, each black vector shows how far users moved. That nexus at the upper right hand corner is probably the Bronx-Whitestone Bridge, one of many river crossings where New Yorkers spent hours in backed-up traffic trying to evacuate (and sending Tweets).
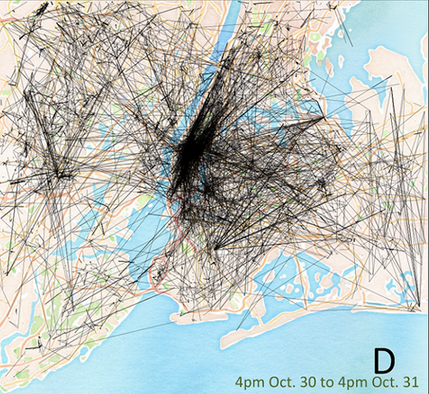
How did these mobility trajectories in the midst of the storm compare to those in the succeeding days? Here are all the locations of tweets during the next 24-hour period, October 30-31:
And here are the movement trajectories for each individual Twitter user. Just one day later, mobility patterns are already quite different.
Jumping ahead a few 24-hour periods to November 5-6 (the researchers plotted out data for 12 full days during and after the storm) mobility patterns were quite similar to October 30-31, but not to that initial 24-hour period.
The researchers also analyzed movement data from November 2013, one year later. Those patterns showed strong similarity to those shown above. That means that after one mere day of perturbation during the Sandy, people went “back to normal”—insofar as their daily movement—with surprising rapidity.
What’s more, previous research has shown that under normal circumstances, urban mobility patterns follow a truncated power law distribution, or the “80/20” rule: 80 percent of movements will be relatively short distances, and 20 percent will be long. Taylor and Wang quantified the statistical distribution of mobility patterns during Sandy’s first 24 hours, and found that they followed the same power law. Short-distance trips significantly increased, and long-distance trips significantly decreased, but the law’s proportions held true. After those first 24 hours, however, the numbers bounced back.
“This brief change in human mobility indicates that New York City residents were resilient to the effects of Hurricane Sandy,” write Taylor and Wang. “This resilience in human mobility was the case even as most public transportation only started to resume partial or full schedule service 36 to 72 hours after Hurricane Sandy struck and over 1 million people in the city were still without power until 2pm Nov. 2.”
[infobox]Is there a quantifiable link between resilience and a storm’s strength?[/infobox]“Resilience” sounds great, but such fast turn-around to regular patterns might not have been great for everyone, given that so much of the city suffered badly from a lack of essential services. Prolonged power outages were in some cases deadly.
Taylor and Wang hope that by quantifying how people moved around during and after Sandy (and during 10 other storms and typhoons that they’re collected Twitter data on), cities might be able to one day predict mobility in the face of a future disaster, and thereby protect and serve residents better.
They’re also curious to understand where the “upper limit” of resilience lies. “After Haiyan,”—the deadliest-ever Philippine typhoon that struck last November—”there was a total breakdown in mobility patterns,” says Taylor. “Infrastructures were completely destroyed, and all kinds of movements decreased, during and following the typhoon.”
Taylor and Wang wonder: Is there a quantifiable link between resilience and the strength of a storm? How might a city or country apply that link to bolster infrastructure and services in advance of a disaster, and possibly avert death and destruction?
Twitter’s data has its limitations, of course. For instance, the demographic to whom Twitter particularly appeals (“younger adults, urban dwellers, and non-whites,” according to a January 2014 Pew Internet Social Media Update) might mobilize differently than others. Science still has a ways to go before cities can apply findings like Taylor and Wang’s in real disaster situations.
“This is a baby step to understanding these patterns,” says Taylor. “This will become powerful when it becomes predictive and a form of intervention, a way to communicate with people who are in areas they shouldn’t be.”
This article originally appeared in CityLab.


