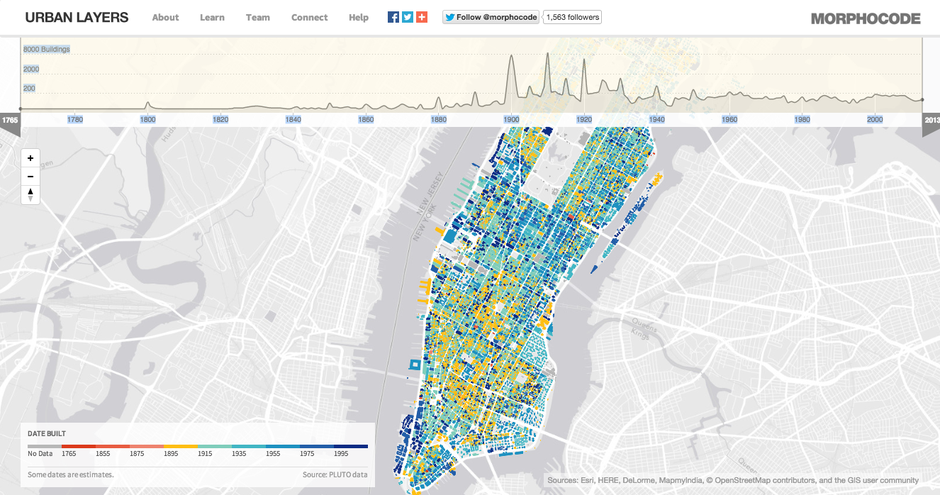
A tool called Urban Layers tracks Manhattan’s rise, block by block, since 1765.
The Harlem Renaissance was the epicenter of new movements in dance, poetry, painting, and literature, and its impact still registers in all those art forms. If you want to trace the Harlem Renaissance, though, best look to Harlem itself.
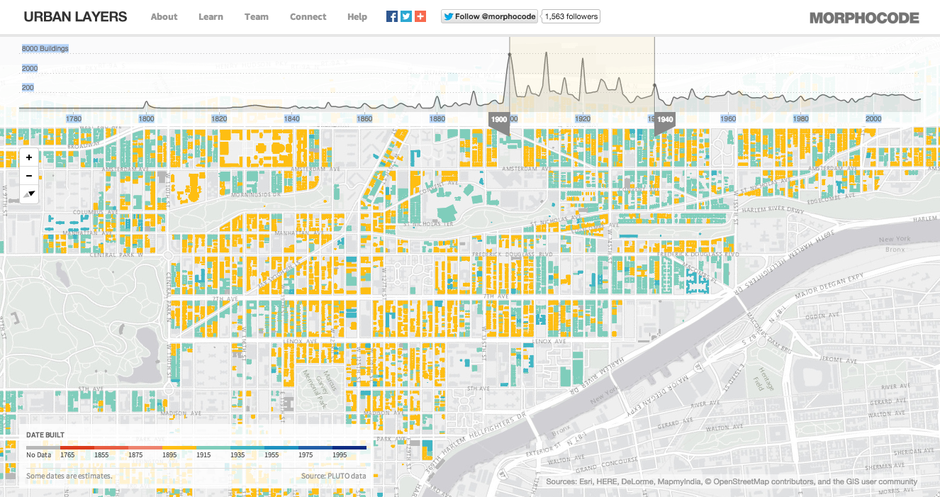
Many if not most of the buildings in Harlem today rose between 1900 and 1940—and a new mapping tool called Urban Layers reveals exactly where and when. Harlem boasts very few of the oldest buildings in Manhattan today, but it does represent the island’s densest concentration of buildings constructed during the Great Migration.
Thanks to Morphocode‘s Urban Layers, it’s possible to locate nearly every 19th-century building still standing in Manhattan today. That’s just one of the things that you can isolate with the map, which combines two New York City building datasets (PLUTO and Building Footprints) and Mapbox GL JS vector technology to generate an interactive architectural history.
From our partners:
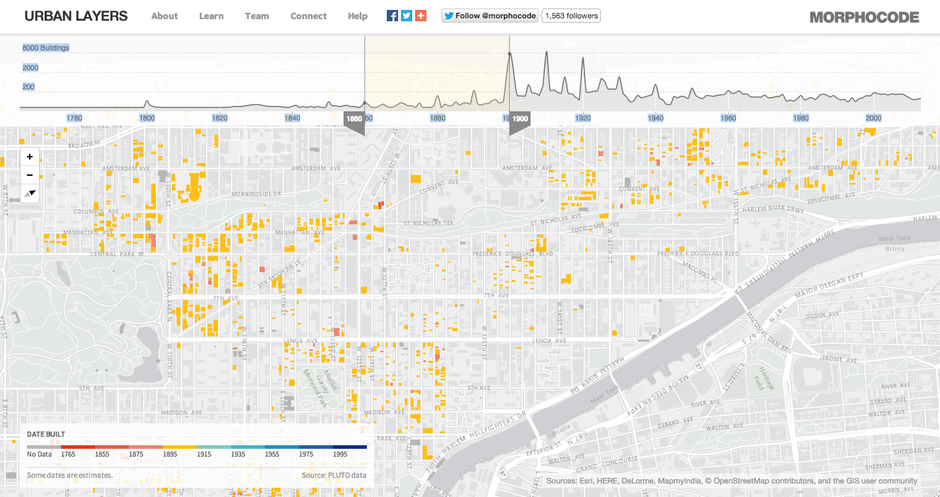
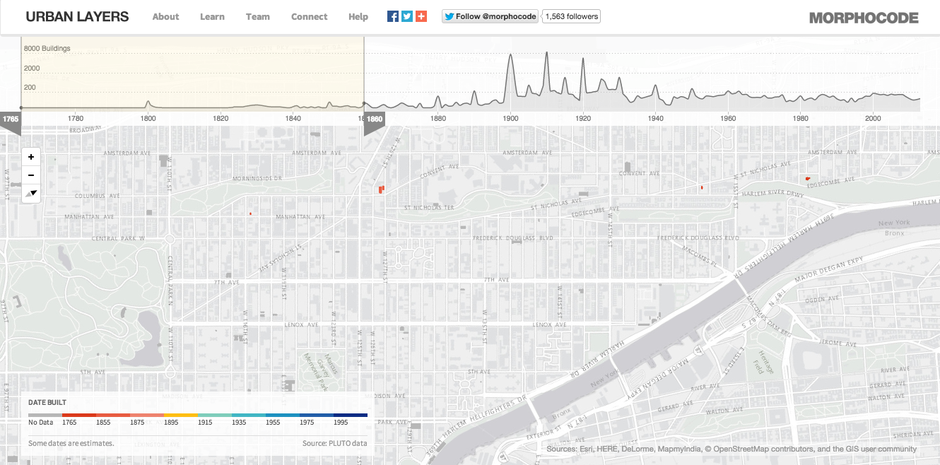
So, looking specifically at Harlem again (with some of the Upper West Side thrown in for good measure), it’s easy to see that very few of the buildings that went up between 1765 to 1860 still stand today.
Toggle the data parameters by a few decades and you see when some pockets of Harlem that still exist start to come into view.
Then construction in Harlem explodes from 1900 to 1940, corresponding with the arrival of migrants from the South. Building slows in subsequent decades before picking up again very recently.
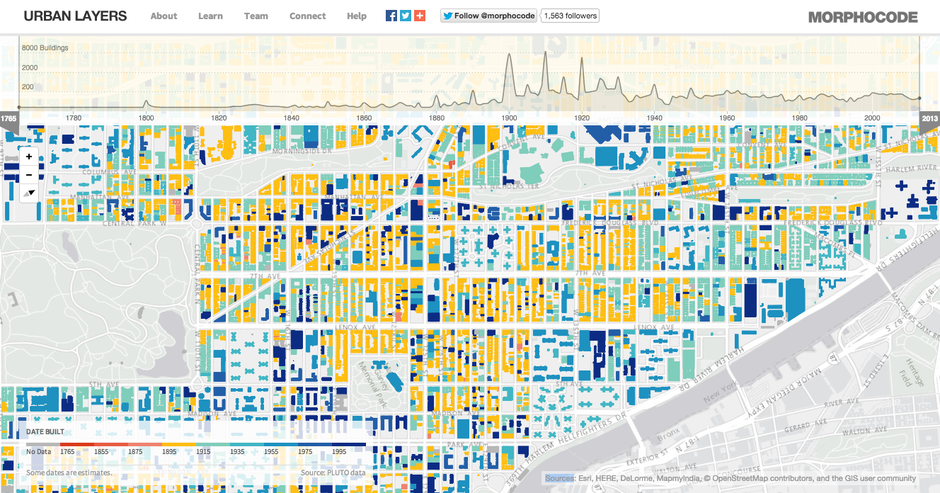
Here’s the more or less complete architectural history of Harlem, represented on one map.
Now, for any Harlem resident, this might seem like the most intuitive discovery in the world. It makes sense that the Harlem Renaissance also made for an uptown building boom, one whose footprint can still be traced there today. The beauty of Urban Layers is that it provides a pretty immediate answer to questions like this one: How old is Harlem?
There are some limitations to Urban Layers, as you might expect: The “year-built” code doesn’t appear to be accurate for every building, as Morphocode explains. In the map showing all construction through 2013, the gray tiles represent the properties for which no “year-built” data are available: about 2 percent of the footprints for Manhattan’s 46,000-odd buildings. Seeing when those buildings were constructed at the parcel level with a simple slide of a rule is a real advance in data mapping.
So many questions! Why did it take New York so long to take to build up around Central Park after its completion in 1857? There was an enormous building boom following the consolidation of the cities of New York and Brooklyn in 1898, just after the end of the rule of the Tammany Hall machine. Is the rise of much of modern Manhattan related to the formal consolidation of the five boroughs?
Manhattanites will all start with the same question: How old are the buildings on my block? With Urban Layers, now there’s a map for that.
This feature is adopted from CityLab.


